Implementing a reliable SPFx PDF export feature is one of the most common enterprise requirements I encounter in SharePoint Framework projects. I have been building dashboards on SPFx for over three years, and this ask keeps coming back: “Can we export this as a PDF?” It sounds trivial, but the moment you sit down to implement it, you realise just how many things can go wrong.
Charts rendered by SVG-based libraries look great on screen but fall apart in export. HTML-to-PDF converters choke on complex layouts. And nobody in the business wants to receive a report where half the charts are blurry or cropped.
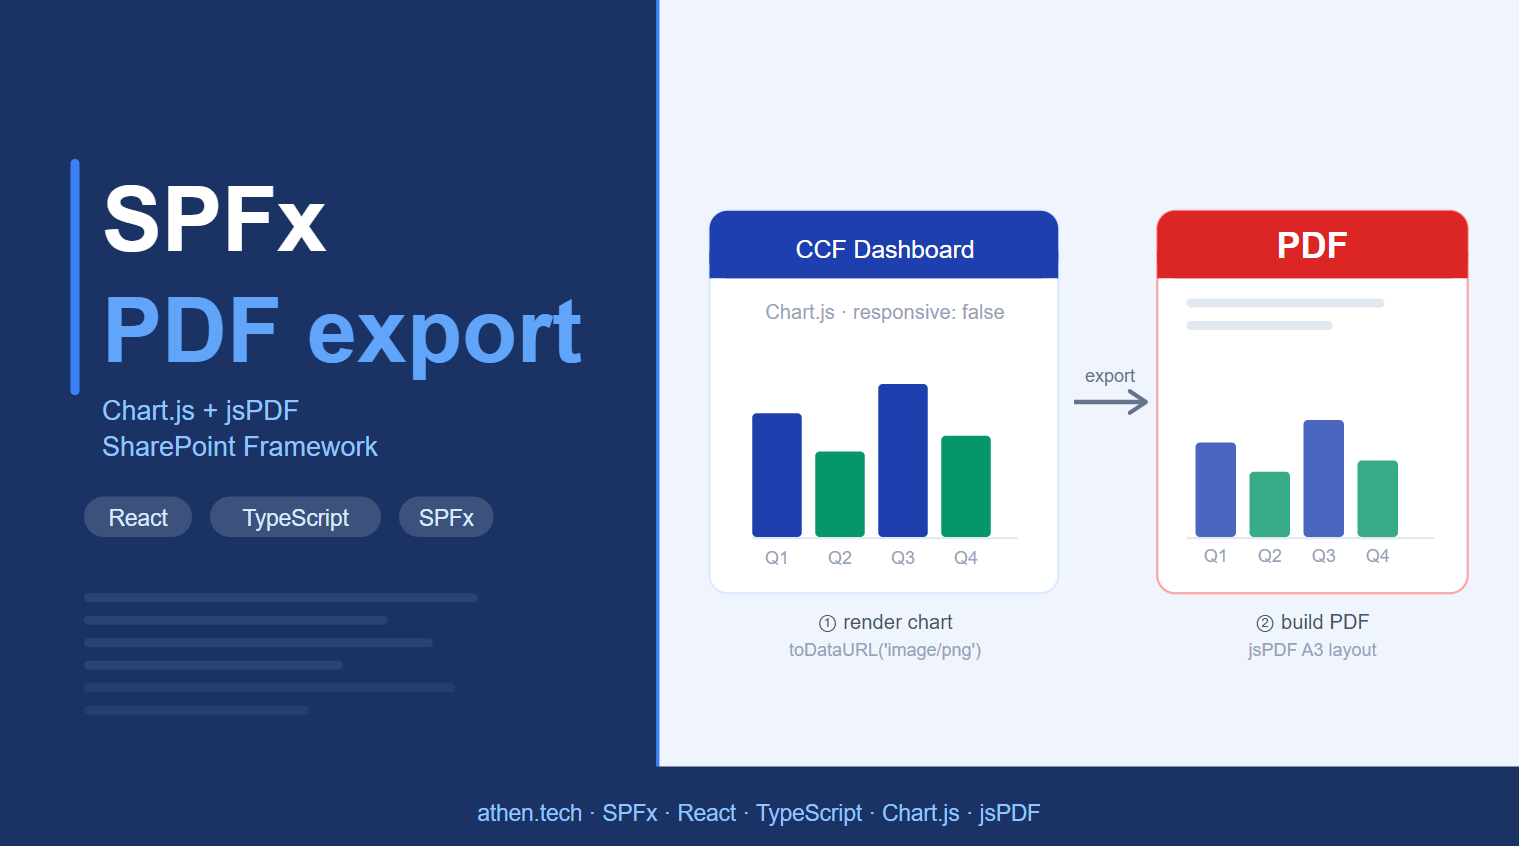
This post captures the approach I settled on after a lot of trial and error — canvas-based rendering with Chart.js, combined with programmatic PDF construction using jsPDF. I’ll walk through the architecture, implementation patterns, and lessons learned so you don’t have to repeat my mistakes. If you’re new to SPFx development, start with my earlier post on getting started with SharePoint Framework.
The Problem with “Just Export It”
When stakeholders ask for PDF exports, they usually imagine something like: click a button, and the dashboard appears as a clean, printable document. What they don’t account for is that web dashboards are inherently dynamic — they’re built for screens, not paper.
Here’s what actually happens when you try the naive approaches:
HTML-to-PDF Libraries
Tools like html2canvas or browser print APIs work fine for simple pages. But in an enterprise SPFx web part with dynamic data, multiple chart types, and responsive layouts, they quickly show their limitations:
- Styles that depend on SharePoint’s DOM context often break or disappear
- Charts embedded in shadow roots or iframes may not render at all
- You have zero control over page breaks, padding, or multi-page layout
SVG Rendering Issues
Popular charting libraries like D3 or ECharts render to SVG, which is great for scalable, interactive UIs. But SVG inside a PDF is a different story:
- Scaling is unpredictable — a chart that looks sharp at 1x becomes blurry or pixelated in export
- Fonts embedded in SVG may not transfer correctly to PDF renderers
- SVG coordinates are relative to the viewport, which means they shift based on scroll position and screen resolution
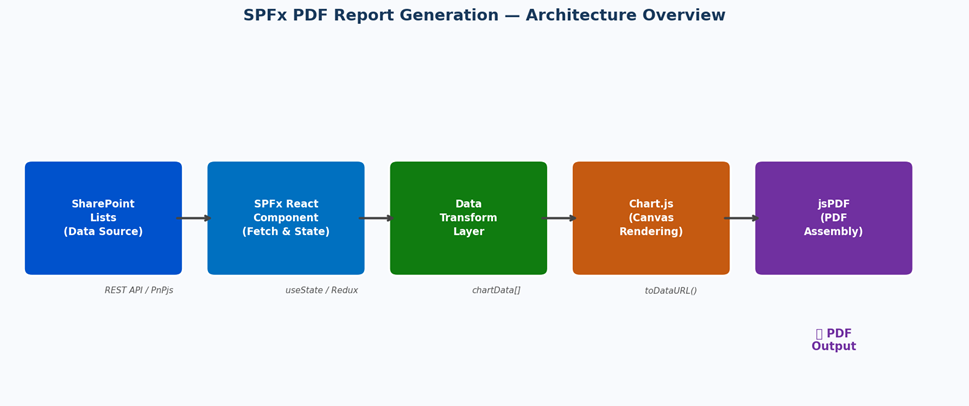
SPFx PDF Export Architecture
The SPFx PDF export solution I settled on follows a clean, linear pipeline. Each step has a single responsibility, which makes it easy to debug and extend.
Let me walk through each stage:
- Fetch data from SharePoint lists using PnPjs or REST calls — keeping this layer thin and focused on raw data retrieval.
- Transform the data into the shape Chart.js expects. This transformation layer is shared between the UI render and the export flow, so your PDF always matches what’s on screen.
- Render charts onto an off-screen <canvas> element using Chart.js. The key here is setting responsive: false so chart dimensions are fixed and predictable.
- Convert the rendered canvas to a PNG data URL via toDataURL(‘image/png’). This is the bridge between Chart.js and jsPDF.
- Insert the image into jsPDF’s coordinate system at precise (x, y) positions. You own the layout — nothing is automatic, and that’s the point.
- Call pdf.save() to trigger the browser download, or convert to a Blob for further processing.
SPFx PDF Export: Implementation Deep Dive
1. Rendering Charts with Chart.js
The single most important configuration choice is responsive: false. If you let Chart.js adapt to its container, the canvas dimensions become tied to the DOM context — which makes your SPFx PDF export dimensions unpredictable. Fix them explicitly:
// canvasRef is a React ref attached to a hidden <canvas> element
const ctx = canvasRef.current.getContext('2d');

const chart = new Chart(ctx, {
  type: 'bar',
  data: {
    labels: labels,
    datasets: [
      { label: 'Plan',   data: planData,   backgroundColor: '#0052CC' },
      { label: 'Actual', data: actualData, backgroundColor: '#107C10' }
    ]
  },
  options: {
    responsive: false,  // CRITICAL — locks dimensions for reliable export
    animation: false,   // Skip animation so canvas is ready immediately
    plugins: {
      legend: { position: 'top' }
    }
  }
});
One thing I discovered the hard way: if you don’t set animation: false, the canvas may not be fully painted when you call toDataURL(). The exported image ends up being a mid-animation frame — half rendered, half blank. Disable animation for export contexts.
2. Converting Canvas to Image
Once Chart.js has rendered to the canvas, capturing it is straightforward:
// Capture the canvas as a base64-encoded PNG
const chartImage = canvasRef.current.toDataURL('image/png');

// If you need to wait for async data before capturing:
await new Promise(resolve => setTimeout(resolve, 100));
const chartImage = canvasRef.current.toDataURL('image/png');
The toDataURL() output is a base64 string that jsPDF’s addImage() accepts directly. No file system interaction, no server round-trips.
3. Building the PDF with jsPDF
jsPDF gives you a blank canvas and a coordinate system measured in millimetres or points. You position everything explicitly. That’s more work upfront, but it means your output is pixel-perfect and reproducible.
import jsPDF from 'jspdf';

// A3 landscape gives you more horizontal real estate for dashboards
const pdf = new jsPDF('landscape', 'mm', 'a3');

// Header
pdf.setFontSize(18);
pdf.setTextColor('#1a3a5c');
pdf.text('DOE Observation Report', 20, 18);

pdf.setFontSize(10);
pdf.setTextColor('#777777');
pdf.text(`Generated: ${new Date().toLocaleDateString()}`, 20, 26);

// Insert chart image: (dataUrl, format, x, y, width, height)
pdf.addImage(chartImage, 'PNG', 20, 35, 180, 100);

// Second chart on the same page
pdf.addImage(chart2Image, 'PNG', 210, 35, 180, 100);

// New page for additional sections
pdf.addPage();
pdf.text('Analysis Summary', 20, 18);

pdf.save('doe-report.pdf');
4. Layout Strategy — The A3 Grid
For enterprise reports with multiple charts and sections, I use an A3 landscape layout with a fixed grid. Here’s the mental model:
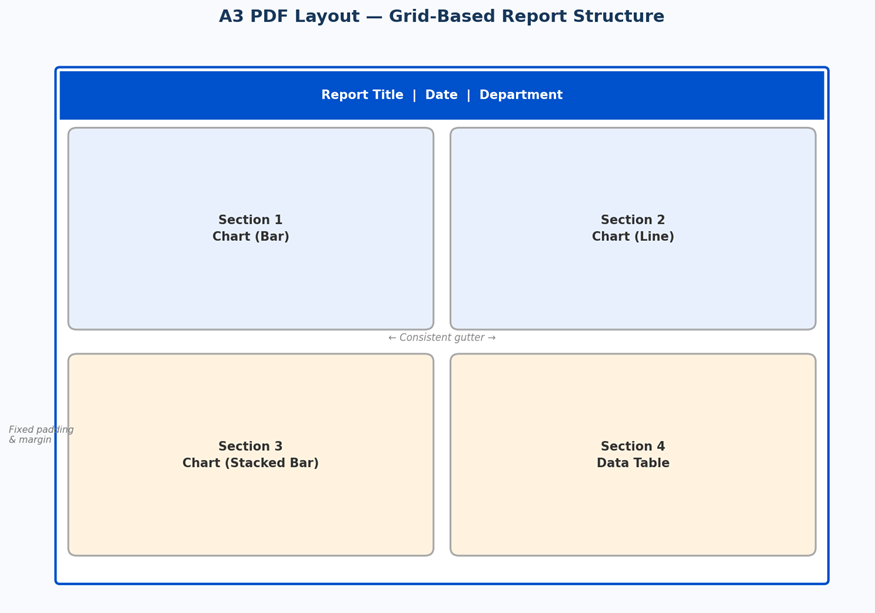
The layout principles that saved me the most debugging time:
- Use A3 (420 x 297 mm landscape) rather than A4 — the extra width lets you fit two charts side-by-side without them feeling cramped
- Fix a gutter constant (e.g., 10 mm) and always calculate positions relative to it rather than hardcoding pixel values
- Render sections in order — Observation, Analysis, Results — with a consistent Y-offset pattern, so adding or removing a section doesn’t cascade misalignments
- Reserve the top 30 mm for a header band (title, date, department) and the bottom 10 mm for a footer
Real-World SPFx PDF Export Challenges — And How to Solve Them
These are the four issues that burned me most during the actual SPFx PDF export implementation. I’m sharing them here because they’re not obvious from reading the docs.
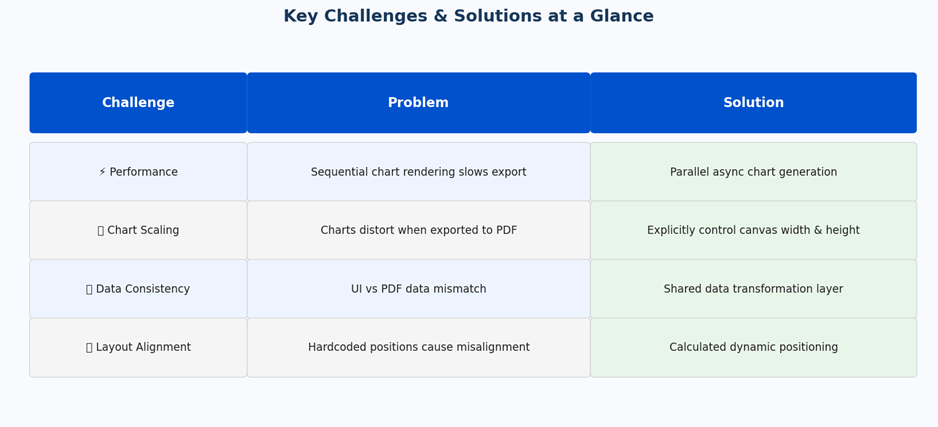
Performance — Rendering Multiple Charts
If you’re generating a report with 6–8 charts and you render them sequentially — create chart, capture image, destroy chart, repeat — the export feels slow. For a report with eight sections, I was seeing 4–6 seconds of UI freeze.
The fix is to render all charts in parallel, using a batch of Promises:
const chartImages = await Promise.all(
  chartConfigs.map(config => renderChartToImage(config))
);

// Then assemble the PDF in a single pass
chartImages.forEach((img, i) => {
  const { x, y } = gridPositions[i];
  pdf.addImage(img, 'PNG', x, y, CHART_W, CHART_H);
});
Chart Scaling — Consistent Dimensions
A chart that renders beautifully at the component’s natural width may look stretched or squashed when inserted into a fixed PDF slot. The solution is to explicitly set the canvas element’s pixel dimensions before creating the Chart.js instance:
// Set the canvas pixel size to match the PDF slot dimensions
// PDF slot: 180mm x 100mm at 96 DPI = 680 x 378 px
canvasRef.current.width  = 680;
canvasRef.current.height = 378;

// Then create Chart.js with responsive: false
// The chart will fill exactly 680x378px — no scaling artifacts
Data Consistency — Shared Transform Layer
Early versions of the export used slightly different data-processing logic from the UI. This led to subtle discrepancies — a bar that showed 42 in the dashboard might show 43 in the PDF because rounding was applied in different places.
The fix is non-negotiable: define a single transformChartData(rawData) function and call it from both the React render path and the export path. Never process data inline in either place. You can find more on this pattern in my post on clean SPFx architecture patterns.
Layout Alignment — Calculated Positioning
If you hardcode pixel positions (pdf.addImage(img, 'PNG', 245, 38, ...)), the moment a section changes height, everything below it shifts. Instead, track a running Y cursor:
let yPos = HEADER_HEIGHT + GUTTER;

sections.forEach(section => {
  pdf.text(section.title, MARGIN_X, yPos);
  yPos += TITLE_HEIGHT;

  pdf.addImage(section.image, 'PNG', MARGIN_X, yPos, CHART_W, CHART_H);
  yPos += CHART_H + GUTTER;

  if (yPos > PAGE_HEIGHT - FOOTER_HEIGHT) {
    pdf.addPage();
    yPos = HEADER_HEIGHT + GUTTER;
  }
});
Final Thoughts on SPFx PDF Export
SPFx PDF export is one of those features that looks simple on a ticket and turns complex the moment you start. The HTML-to-PDF path is tempting because it requires less upfront setup, but in my experience it consistently fails to hold up under real enterprise requirements.
The canvas-based approach with Chart.js and jsPDF is more explicit — you have to define your layout manually, you have to control canvas dimensions, you have to think in millimetres. But that explicitness is also its strength. You know exactly what you’ll get, every single time, on every machine.
If you’re building this for a compliance application, an audit dashboard, or any context where the exported document is a formal artefact rather than a convenience feature, the extra investment is absolutely worth it. Have questions about the SPFx PDF export approach? Drop them in the comments below.